Get to the plotter!
2018-06-10 · Arduino Data acquisition Measurements

If you’ve done experimental research you’re probably familiar with having to acquire signals in some way and then visualizing the results in some kind of plot. There’s a gazillion ways of doing this ranging from manually inputting values into an Excel spreadsheet followed by plotting to using something like LabView and Matlab. While these tools can be great and efficient, I wanted to try a more minimal approach.
The software I ended up using was
- Platformio (with Makefiles and vim)
- screen
- and R (with vim of course).
The basic test I needed to perform a while back was to see how much force a linear stepper motor could produce at different motor driver current limits. I was too lazy to write a separate control software for the stepper so I just used one of those cheap grbl-arduino-nano boards to control the linear stepper via standard gcode. The data acquisition was based on the Teensy 3.2 which was hooked to the load cell via a HX711 load cell amplifier (these are pretty noisy, I’ve since changed to an ADS1232).
The entire code is linked below but basically I printed the load cell output accompanied with a time stamp using standard arduino commands.
  LoadCell.update();
  if (millis() > time + 200) {                  //sample rate of ~ 5 SpS
       mass = LoadCell.getData();
       time = millis();
       Serial.print(time);
       Serial.print("\t");
       Serial.println(mass);
     }
You could log this output into a file using cutecom or even the arduino serial monitor. I opted for screen though.
screen /dev/ttyACM0 115200You can start the screen.log by ctrl+a and h. The resulting logs can be plotted using for example R
 path1 <- ("~/Software/Platformio_projects/hx711_teensy/logs/log12V1.0")
 df1 <- read.table(file=path1,header = TRUE, skip=0, sep="\t", dec=".",col.names=c("time","mass"))
 df1$time = (df1$time - min(df1$time))/1000
 df1$force= (df2$mass/1000)*9.81
 plot(df1$force~df1$time,ylim=c(0,350),xlim=c(0,35), type = "l",lwd=2, col="red",ann=FALSE)
 title(main  = "Linear stepper motor force output", line=0.5)
 mtext(side= 1, text = "Time (s)", line=2.2)
 mtext(side= 2, text = "Force (N)", line=2.2)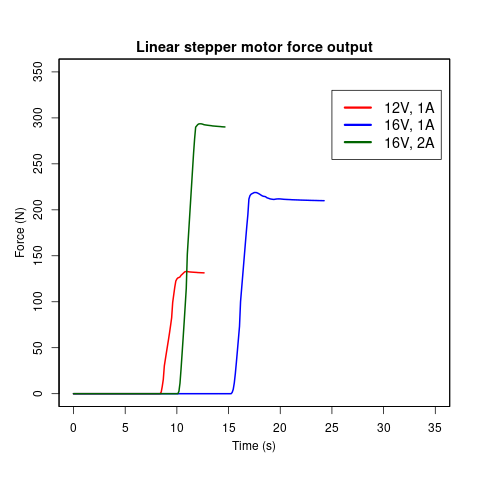
related posts
- Octave Serial Plotter 2020-08-31
- Telegram emoji display 2020-08-17
- Iperf on ESP32 2019-02-12