I really like using Flask to prototype web services. I guess the grown-up alternative is Django but the minimalism of Flask appeals to me.
I recently made a really simple demo of how to visualize the result of an analysis using Flask and javascript. It was inspired by JAMstack even though this app is not JAMstack. Hence the name JAMFlask.
You can find the code on my gitlab. The main motivation in making this was to brush up on javascript. I guess it’s a bit old-fashioned not to use React, Vue, Angular etc. but this way it’s maybe easier to understand how this site functions.
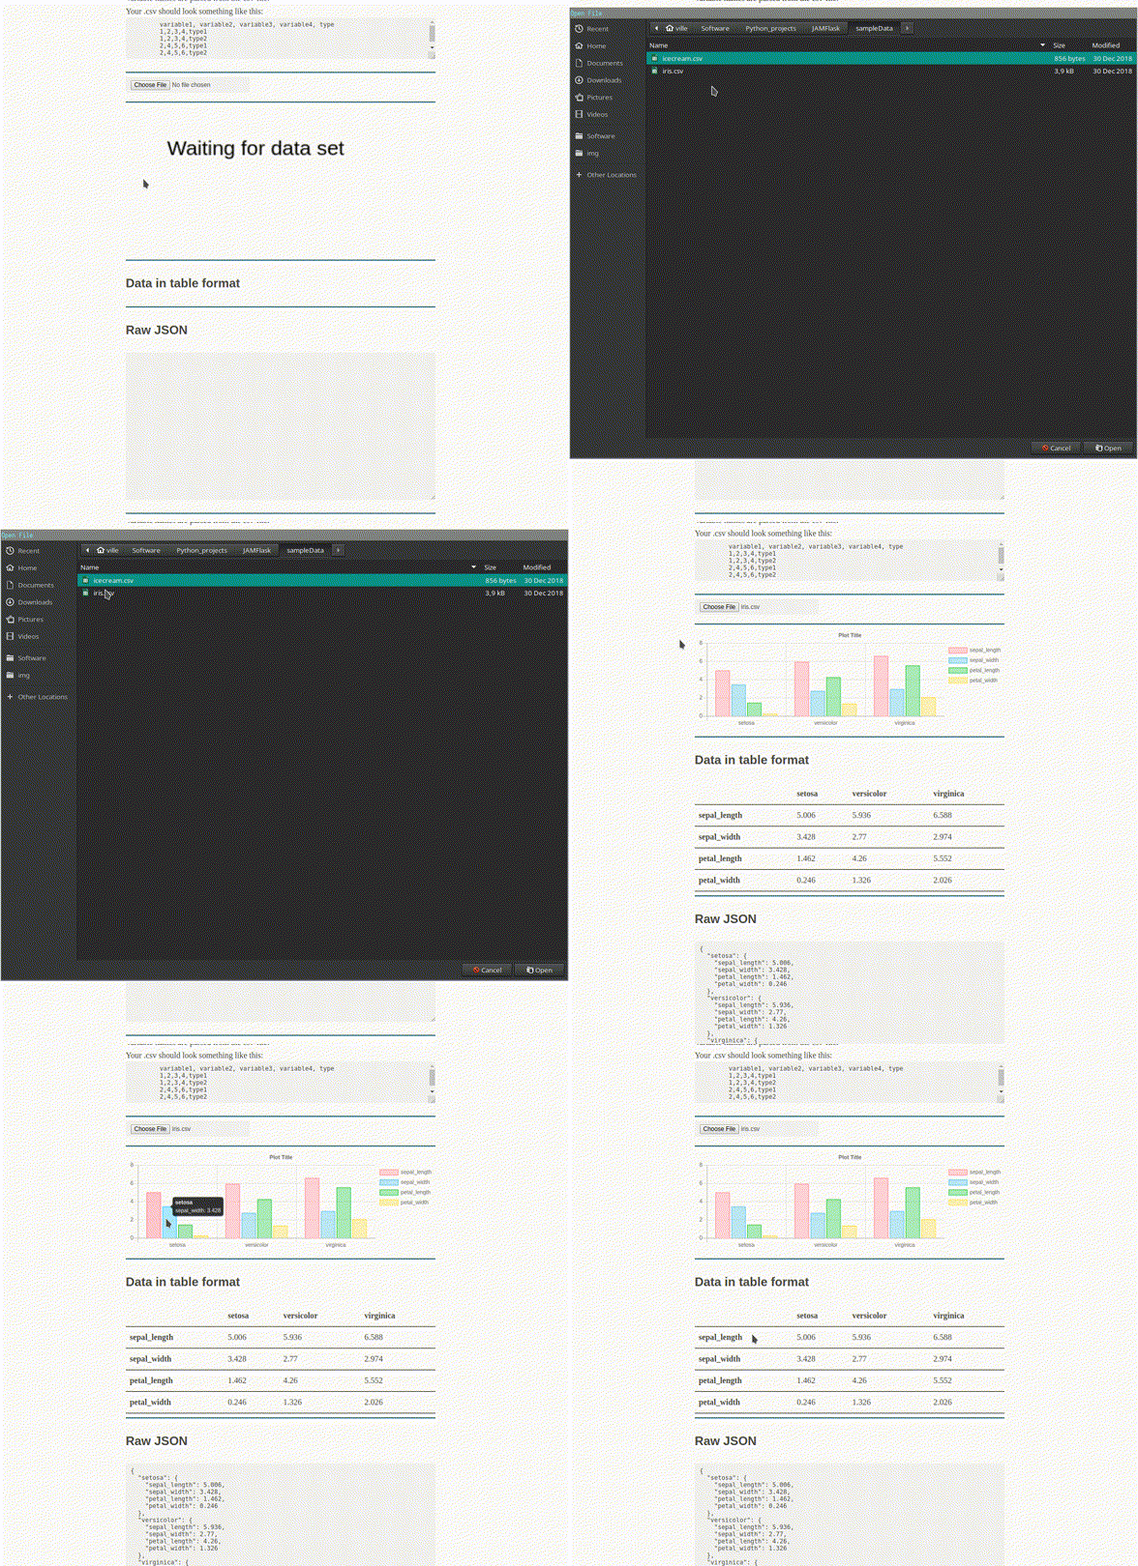
In a nutshell, the user can upload a csv-file to the service. The csv-file is passed to an analysis.py script that returns the result of a simple grouping and mean calculation as json. This json is then used to generate a barplot with Chart.js. For the user it looks like this:
