Animations with Octave and ImageMagick
2020-05-04 · Data visualization
Most people like pictures. Many of those people adore animations. In the data visualisation scene animation is a wonderful way of getting an additional axis to work with and thus enrich the story you want to tell. The most obvious way to use that axis is probably visualizing the change of some phenomenon in relation to time, but animations are also a great tool to get an intuition on how a parameter influences the behaviour of a system or how an iterative algorithm functions. A wonderful example of the power of animation is the work done by 3Blue1Brown. His videos are produced with a purpose-built python animation engine. In this post we’ll keep it simpler.
There are plenty of tutorials on how to do animations in Python so I went with Octave here. Nonetheless, this approach is based on producing a bunch of still images and then joining them with ImageMagick so if you are able to make a series of images you should be able to turn them into an animation.
Simple example
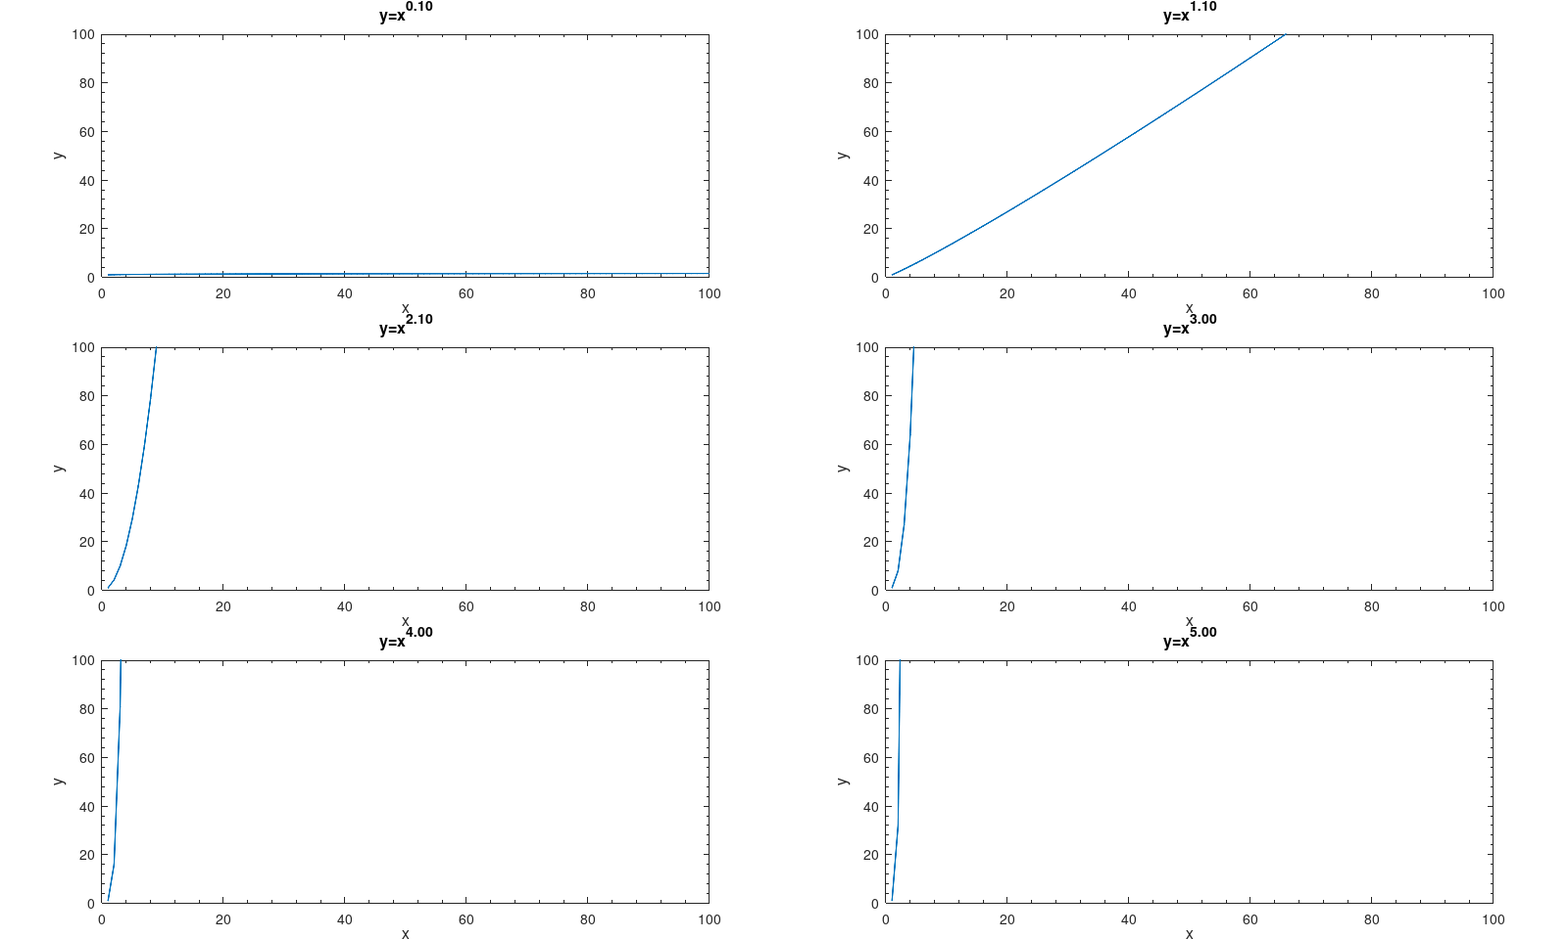
The animation below visualizes y=xk where k = 0.1 … 5.0 with 0.1 increments.

Producing the gif in Octave (with a call to ImageMagick’s convert) is straightforward.
rmdir out;
mkdir out;
x = [1:100];
for p = 1:50
    f = figure("visible","off");
    k = p / 10
    h = plot (x, x.^k);
    axis([0,100,0,100])
    filename=sprintf('out/%05d.png',p);
    title_str = sprintf('{y=x^{%.2f}}',k);
    xlabel("x");ylabel("y");
    title(title_str);
    print(filename, '-dpng', '-S800,320');
end
system("convert -delay 10 -loop 0 out/*.png output.gif");
Unless you are hellbent on gif you should probably consider something like mp4. You can do this by simply replacing the file extension in the convert command. mp4 videos are usually substantially smaller (here the gif is ~248 KiB and the mp4 is ~ 53 KiB). If you autoplay and loop the result, it’ll be almost indistinguishable from a gif. There’s animated png also but that’s beyond the scope of this post.
PRO-TIP: If you want the video to work in Firefox you may also need to convert the video to yuv420 (from yuv444).
ffmpeg -i output.mp4 -pix_fmt yuv420p -vcodec libx264 -crf 20 output_ff.mp4
K-means clustering visualization
As mentioned in the introductory paragraph, animations are a great fit for visualizing iterative algorithms. The visualization below shows how centroids are moved in k-means clustering. The code is based on the exercises of Andrew Ng’s ML course.
related posts
- Octave Serial Plotter 2020-08-31
- Make gnuplot cool again! 2019-08-18