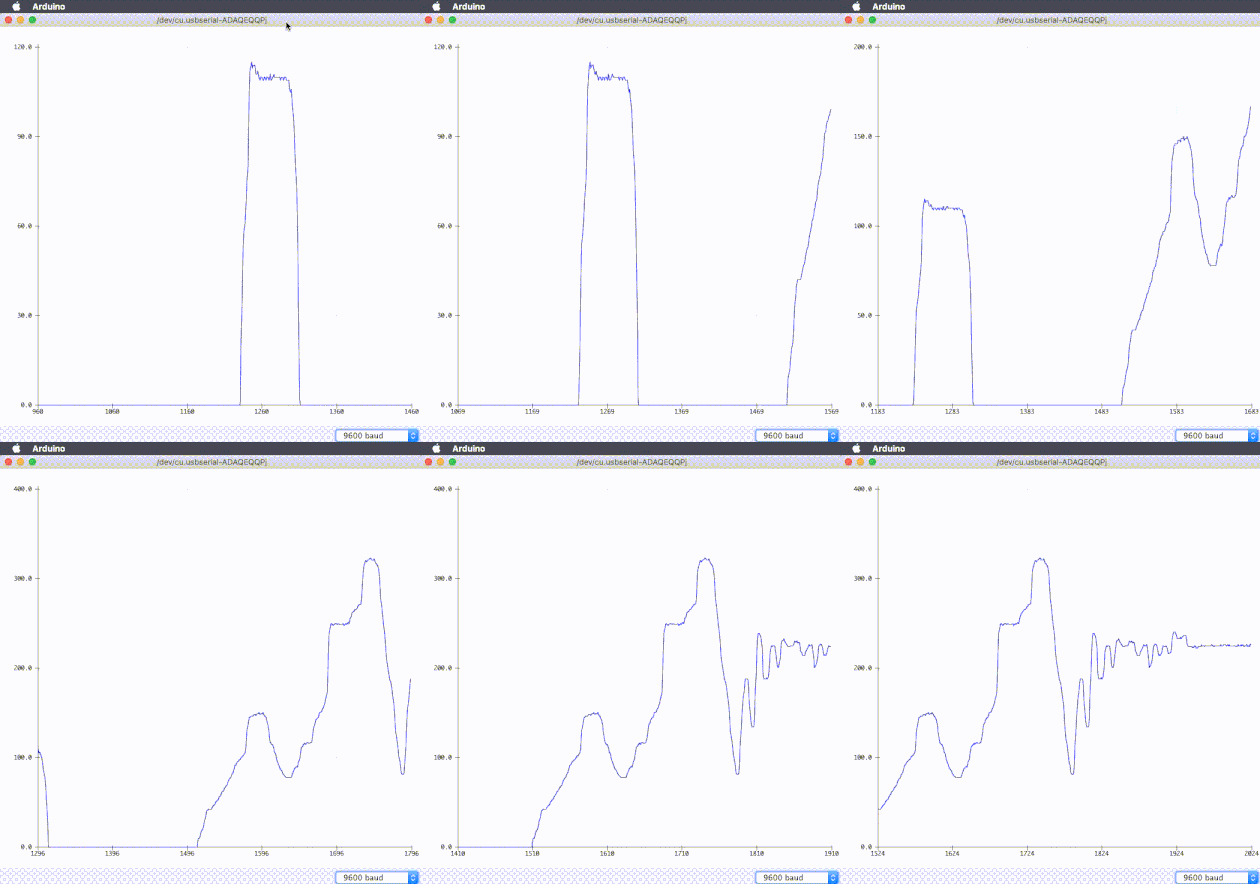
I’ve long since renounced the official Arduino IDE and switched to Platformio. While the official IDE is a great way to start, it quickly becomes frustrating if you are used to working with specific editors and bigger projects structured in multiple source files and directories. Platformio is in my opinion the best tool for ‘slightly-more-serious-maker-style’ embedded development. It is usually operated via VS Code but it can also be used through the command line interface. Personally, I’ve grown accustomed to using platformio commands either on their own or with the help of a Makefile. I also prefer the way platformio handles libraries project-specifically instead of globally. I know there are all sorts of tricks you can do with the Arduino IDE but I cannot go back to it anymore especially because of the debug tools and code analysis available in Platformio. The only feature I miss from the official Arduino IDE is the serial plotter.
Serial plotter ?

The serial plotter makes it possible to quickly (ctrl+shift+l) bring up a line chart of serial data. The tools doesn’t require configuration and is able to parse the serial data stream into useful visuals without too much headache. No firmware changes are necessary for plotting with the serial plotter. Just Serial.println. Especially, when you have more than one value whizzing by in the serial monitor this is a really useful tool.
Real-time(y) plotting
I’ve stepped into this ‘real-time plot’ rabbit hole more than once. This stackoverflow thread contains most of the options although it might be a bit out of date. Despite a multitude of options, none of them have been satisfactory. Either they are too slow and clunky, or they hog resources or they require per-project configuration and modification of the firmware and visualization script. If you are building a visualizer for a specific case with a pre-defined data stream, then I suggest checking out this post by the ThePoorEngineer. It also goes through some simple methods on optimizing the serial data stream size. If I was developing a visualizer for a specific purpose I might also check out matplotplusplus for a C++ alternative.
So we have to visualize something and python is not performant enough…
What else i got on my computer already that could do this plotting stuff? 🤔
First I thought Gnuplot (because it is cool), but then I figured that maybe this needs more efficient vector operations and a fuller environment. Then it hit me, Octave, of course! A quick test with the instrument control package revealed that, yes indeed, reading a serial port is not a problem. I’ve grown increasingly fond of Octave, which makes me a bit worried that I’m slowly retrograding back to using boomer-Matlab.
Features
| Features | Description |
|---|---|
| Automatic | Automatically figures out signal count from serial data stream |
| Responsive | Minimum 30 samples per second (read, parse, render) |
| Efficient | I don’t want to hear my CPU fan spin up every time I start it |
| Maintainable | Concise (preferably less than 100 lines) and readable |
| Export | Ability to save the plots as images or save the line data as csv |
A notable non-feature is that I don’t need any guarantees of actual real-time (in the deterministic engineering sense). Here, I am happy with perceived real-time.
Result
I called it splot and you can find splot on my gitlab. If you place splot in a file that is in your $PATH then you can run it with just
splot
#Or give it a port and baudrate as arguments
splot /dev/ttyACM0 38400
The demo video below shows how the splot utility is easy to start from the command line.